

HEALTH ECONOMICS
Removing a negative does not always add a positive: how decision analysis can probably help you
![]()
Jeffrey S. Hoch, PhD, Carolyn S. Dewa, MPH, PhD
In this seventh article in the health economics series, we introduce decision analysis to provide leaders with insights when making strategic decisions amidst uncertainty. The additional clarity offered by decision analysis can improve decision-making by organizing evidence to allow better interpretation of the data. A hallmark of decision analysis is a model structure that illustrates what is known (e.g., strategies and types of outcomes) and what is unknown (e.g., a certain future). Results from this type of research help leaders understand what their options are and how to think optimally when making decisions under uncertainty.
KEY WORDS: leadership, decision analysis, health economics
Hoch JS, Dewa CS. Removing a negative does not always add a positive: how decision analysis can probably help you. Can J Physician Leadersh 12(1): 18-25. https://doi.org/10.37964/cr24802
Decision analysis can help leaders organize their thinking about a problem’s structure and uncertainty. Many challenges lend themselves to this manner of organizing. Let’s take a day-to-day example in which you probably have used decision analysis. Remember the last time you were faced with the decision of whether to pay for parking? Your answer probably depended on beliefs about the likelihood of a ticket as well as the facts about parking cost and fines (ethics of not paying aside). If you think the likelihood of getting a parking ticket is low, you might decide to forgo paying. On the other hand, if the likelihood is high, you might decide to pay. Decision analysis can guide other decisions as well, from modeling mitigation strategies for a pandemic1 to optimizing diagnostic procedures for the diagnosis of Whipple’s disease.2
In this article, we explore the use of a decision tree to help resolve a paradoxical example involving a funding announcement. The structure of the decision combined with the use of probabilities for uncertain events can help to guide leaders toward more accurate evidence-informed insights.
Introducing the decision tree
Analyzing the decision about whether to pay for parking illustrates a key concept of decision analysis. Table 1 summarizes the main information: paying for parking costs $10; the parking fine is $30; and the probability of a meter visit from parking enforcement is one in three.
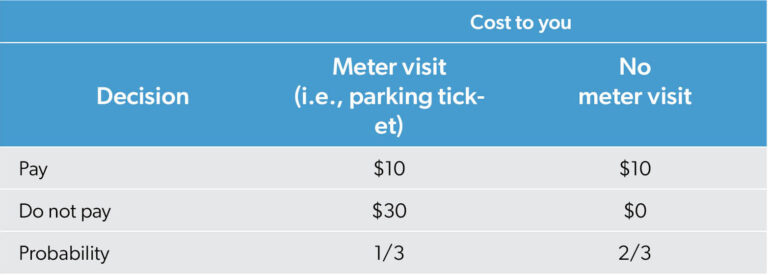
Figure 1 illustrates a decision tree with the branches showing the events that could occur and their probability. The two options “Pay for parking” and “Don’t pay for parking” have different costs (with these “payoffs” shown on the right side of Figure 1).
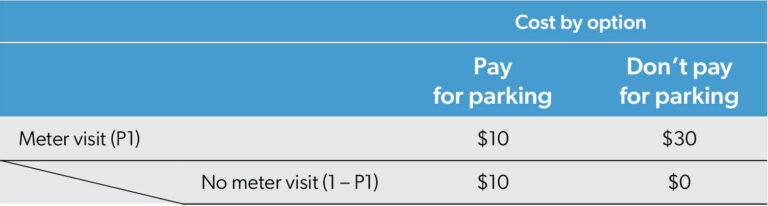
Note, the probability of a meter visit (P1) is unaffected by one’s decision to pay for parking. Based on the assumptions in Table 1, P1 = 0.33. The feeling that a meter visit is more likely if one has not paid for parking could be incorporated by introducing a different probability P2 > P1. However, for this example we will assume that a meter is inspected by parking enforcement one out of every three times you park; this visit is not related to whether you pay for parking. The payoffs differ between the pay for parking and the don’t pay for parking options in the right side of Figure 1 (as specified in Table 1).
Because of uncertainty (about a meter visit), one must compute “expected” values to inform the decision of whether to pay. Expected does not mean what you expect to happen to you this time. Rather, it means if you faced this choice many, many times, overall, what could we use for the average (needed for overall impact). This is an important distinction. What happens to you as an individual is that you will either get a ticket or not; parking enforcement does not give you 1/3 of a ticket. When considering a large set of occurrences (e.g., you park there every day for 300 days), the average is 100 parking enforcement meter inspection visits. As a leader responsible for a large group or large number of occurrences, an average is crucial for assessing the overall impact or total. The individual perspective concerns itself with what will happen to a person in this one instance. The population or expected value perspective suggests overall parking fines of $3000 this year (i.e., the product of $30 fine per ticket and 300/3 expected tickets).
The difference between individual and population experience highlights the tension clinical leaders face. From their clinical experience, leaders may have familiarity with dealing with the mismatch between patient preferences and population guidelines. For example, theoretically different “optimal” amounts of chemotherapy may exist.3 For decision analysis, computing expected value is the key calculation to do what is best for the population for which you are responsible.
Expected values are computed by multiplying probability times “payoff” (i.e., outcome). In our parking example, we are concerned about costs. Combining Table 1 and Figure 1 illustrates the process of computing the expected costs for both options: pay for parking vs. do not pay for parking. The top branches representing the pay for parking choice show paying $10 for parking will cost you $10 regardless of whether there is a meter visit from parking enforcement. The lower branches show the cost and expected cost of not paying for parking. The 1/3 chance of a $30 parking ticket combined with the 2/3 chance of no ticket generates an expected cost of $10 (i.e., 1/3 x $30 + 2/3 x $0 = $10). From a one-time (individual) parking perspective, if you do not pay for parking, you will either get a $30 ticket or have $0 cost. From a multiple time (population) perspective, you should budget about $10 a day for the expected cost of the “do not pay for parking” strategy, under the current conditions (i.e., parking enforcement does not increase its diligence or becomes more merciful).
With the current assumption that the probability is 1/3 that parking enforcement will issue a ticket, both strategies have the same expected costs. While the “do not pay for parking” strategy has more variability in costs (i.e., $0 or $30), the expected cost is $10 for both strategies.
A paradoxical example
Background
You are the lead physician executive for a health care organization in region A. To address the primary care crisis, the ministry of health has decided to fund a massive “Integrated Primary Care Pilot” in one of three rural regions: A, B, and C. The ministry has already selected the region, but the decision is under embargo. However, the minister’s chief of staff knows which region was selected.
As the physician lead for region A, you know that the chief of staff cannot tell you whether your region was chosen. Nevertheless, you ask them privately, “I know you cannot tell me if my region got the pilot, but of the other two, can you tell me one region that definitely did not get the funding? If region B was selected for the pilot, tell me region C lost out; if region C was selected, tell me region B lost out; and if my region A was selected, just flip a coin and name either B or C as a loser.” This is your initial data.
The chief of staff responds, “Region B will not receive the funding.” This is new data to incorporate into your analysis.
How decision analysis improves thinking
Figure 2 illustrates the different possibilities occurring with the probabilities described above.
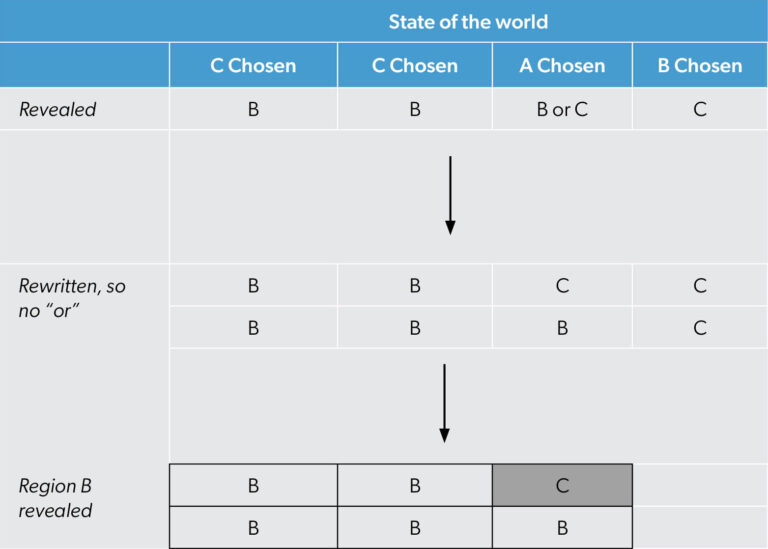
The state of the world columns in Figure 2 shows the different potential winners of the ministry of health funding. The column labeled “C chosen” appears twice and the others only once because of your initial beliefs about the minister choosing region C (1/2), region A (1/4) and region B (1/4). The directive, “If my region A was selected, just flip a coin and name either B or C as a loser” can be seen as “B or C” in the first row labeled Revealed. To translate this into something more mathematical with equal probability (1/2 vs. 1/2) for B and C, Figure 2 shows another row labeled Rewritten, so no “or”. In this row section, it is clear that if region A is selected, half of the time B will be revealed, and half of the time C will. The last row section of Figure 2 incorporates the new information when the chief of staff says region B will not receive the funding; it is possible to rule out scenarios where region C is the denied region (e.g., the last column of Figure 2). Now, we can redo the analysis using new evidence. Only the scenarios from the first three columns remain.
The cells traced by the heavy line in Figure 2 are the only ones that accurately describe the reality. Four of five times, region B is revealed if region C was selected as the winner; one of five times this occurs if region A is the winner. Figure 2 illustrates this with four region B cells in the C is chosen columns and only one region B cell in the A is chosen column. In our example, there are only five situations where B is revealed. According to Figure 2, with region B ruled out, there is a 20% (1/5) chance region A won; conversely, there is an 80% (4/5) chance that region C won.
Discussion
Initially, you believe region A has a 25% (1/4) chance of receiving funding. After the chief of staff’s comment, this shrinks to 20% (1/5) given region B is eliminated. At the same time, region C now has an 80% (8/10) chance of getting the funding (up from the initial 50% (1/2)). Manager 1 who felt that there was a 50/50 chance that the funding would go to either region A or region C missed the importance of the fact that region C had an inside track. Region C’s initial probability was 50% (1/2), leading to an unequal distribution of “Bs” on the last row section of Figure 2 (compare the Bs in the “C chosen” columns to those for the “A chosen” column). Manager 2 felt that region A started with a 25% (1/4) chance of winning and still had a 25% (1/4) chance of being the winner. This ignores the opportunity to update beliefs based on new data. When the chief of staff removes from consideration the lower probability region (in this case region B), then region A’s chances decrease.4 This is because, as explained elsewhere,4 the probability that region A wins given that region B is removed from consideration equals the product of PA and 1/(1 + δcd) where PA is region A’s initial probability and δcd = PC – PB. In our example, δcd = 1/2 – 1/4 = 1/4. Therefore, the likelihood that region A wins given that region B is removed from consideration equals the initial probability for region A (i.e., PA) shrunk by a factor of 4/5. The likelihood of region A winning shrinks to 80% of its original estimate (i.e., 1/4 x 4/5 = 1/5) after the chief of staff shares the additional information (that region B did not receive the funding). It is left as an exercise for the reader with insomnia to show that even with equal initial likelihoods of receiving funding (i.e., PA = PB = PC = 1/3), when the chief of staff rules out region B then region C’s chances of winning the funding double from 1/3 to 2/3 (hint: remove one of the C chosen columns from Figure 2).
This article contributes to the health economics series5-10 by illustrating how leaders can approach uncertain decisions using decision analysis. However, there are some challenges associated with the technique: the structure of the model and data inputs. In a perfect world, the model structure is simple but complex enough to capture key elements of the problem. There are examples where more complicated approaches have been used in complex contexts, such as screening for infectious diseases, and they produced different results from those reported in earlier papers.11
Lack of data can also be challenging. For example, in 2011, when provincial decision-makers were considering the cost-effectiveness of adjuvant trastuzumab with chemotherapy for the treatment of HER2-positive breast cancer patients with node negative tumours ≤ 1 cm, no direct evidence supporting the effectiveness of trastuzumab in these patients was available. The Pharmacoeconomics Research Unit had completed analysis to inform the decision,12 but the results were only as strong as the evidence used in the model. Moreover, a trial for such patients was considered unlikely. In the absence of strong evidence supporting the use of trastuzumab in this patient population, conditional funding for these patients was approved with the expectation that real-world data would be collected to evaluate the clinical safety, effectiveness, and cost-effectiveness and inform a final funding decision.13
Although health economists often use decision analysis for economic evaluation, the techniques and way of thinking can help leaders examine complicated and unintuitive circumstances. The paradoxical example we explored is based on the “problem of three prisoners.”14,15 Research has studied the many ways people become confused when addressing this type of situation.4 Decision analysis can help by organizing initial uncertainty (e.g., prior beliefs about funding) showing the need to update probabilities based on new information when it becomes available (e.g., after the chief of staff shares the news about region B). The example illustrates how information that removes a negative (region B did not get funding) does not always add a positive to your position. In fact, the news about region B decreased the likelihood of funding for your region. Understanding how to make decisions under uncertainty is crucial for leadership. Decision analysis is a valuable tool for discovering insights that leaders need.
References
- Gojovic MZ, Sander B, Fisman D, Krahn MD, Bauch CT. Modelling mitigation strategies for pandemic (H1N1) 2009. CMAJ 2009;181(10):673-80. https://doi.org/10.1503/cmaj.091641
- Olmos M, Smecuol E, Mauriño E, Bai JC. Decision analysis: an aid to the diagnosis of Whipple’s disease. Aliment Pharmacol Ther 2006;23(6):833-40. https://doi.org/10.1111/j.1365-2036.2006.02822.x
- Hoch JS, Beca J, Chamberlain C, Chan KK. The right amount of chemotherapy in non-curable disease: Insights from health economics. J Cancer Policy 2016;10:30-5. https://doi.org/10.1016/j.jcpo.2016.05.002
- Shimojo S, Ichikawa SI. Intuitive reasoning about probability: theoretical and experimental analyses of the “problem of three prisoners.” Cognition 1989;32(1):1-24. https://doi.org/10.1016/0010-0277(89)90012-7
- Hoch J, Dewa C. The occult of efficiency: frank and Stein’s advice for physician leaders. Can J Physician Leadersh 2024;10(1):29-32. https://doi.org/10.37964/cr24780
- Hoch J, Dewa C. Cost is not a four-letter word: focus on what you can change. Can J Physician Leadersh 2024;10(2):64-8. https://doi.org/10.37964/cr24783
- Hoch J, Dewa C. Maximizing success when it is the product of two things that go in opposition directions: the magic of elasticity. Can J Physician Leadersh 2024;10(3):84-91. https://doi.org/10.37964/cr24784
- Hoch J, Dewa C. Cost-minimization analysis: showing something is cheaper does not necessarily show that it is better. Can J Physician Leadersh 2025;11(1):31-9. https://doi.org/10.37964/cr24789
- Hoch J, Dewa C. Choosing one from many: efficiency in a multi-option world. Can J Physician Leadersh 2025;11(2):102-8. https://doi.org/10.37964/cr24793
- Hoch J, Dewa C. Analyzing cost-effectiveness data: from calculation to illustration. Can J Physician Leadersh 2025;11(3):143-51. https://doi.org/10.37964/cr24798
- Barton P, Bryan S, Robinson S. Modelling in the economic evaluation of health care: selecting the appropriate approach. J Health Serv Res Policy 2004;9(2):110-8. https://doi.org/10.1258/135581904322987535
- Hoch J. Improving the efficiency of cost-effectiveness analysis to inform policy decisions in the real world: Early lessons from the Pharmacoeconomics Research Unit at Cancer Care Ontario. In G. Zaric (Editor), Operations Research in Health Care. 2013. Hardcover ISBN: 978-1-4614-6506-5 Accessed December 7, 2025: https://www.cancercareontario.ca/sites/ccocancercare/files/assets/CCOEBPHerceptinUpdate.pdf
- Lindley DV. Making decisions. London: John Wiley; 1971.
- Mosteller F. Fifty challenging problems in probability with solutions. Reading, MA: Addison-Wesley; 1965.
Authors
Jeffrey S. Hoch, MA, PhD, is a professor in the Department of Public Health Sciences at the University of California Davis (UC Davis). He is chief of the Division of Health Policy and Management and associate director of the Center for Healthcare Policy and Research at UC Davis.
Carolyn S. Dewa, MPH, PhD, is a professor in the Department of Psychiatry and Behavioral Sciences and the Department of Public Health Sciences at UC Davis.
Correspondence to:
jshoch@health.ucdavis.edu