

HEALTH ECONOMICS
Choosing one from many: efficiency in a multi-option world
![]()
Jeffrey S. Hoch, MA, PhD, and Carolyn S. Dewa, MPH, PhD
In this fifth article in a series on health economics, we focus on choosing the best option among multiple choices. Leaders must understand how to rule out poor choices and then decide which of the remaining options is best. Building on previous articles, we focus on a concept called the efficiency frontier and show how cost-effectiveness analysis is used to inform choices among options on the frontier. Knowledge of how to choose among multiple options can help leaders in complicated scenarios where optimal courses of action may not be immediately evident.
KEY WORDS: leadership, optimization, cost-effectiveness, health economics
Hoch JS, Dewa CS. Choosing one from many: efficiency in a multi-option world. Can J Physician Leadersh 2025; 11(2): 102-108. https://doi.org/10.37964/cr24793
Many decisions are of the e pluribus unum variety. Out of many options, one must be chosen. Each option has its own expected cost and outcome (or effect). Among various cost and effect profiles, how is one to choose? Suppose all options are bad and differ by degree. When comparing these options, some will look better than the others. How can leaders avoid choosing poorly while reducing the information overload from considering many options simultaneously?
In this article, we show how to use an efficiency frontier to organize information when considering multiple options. The frontier separates efficient from inefficient choices (when the objective is to achieve efficiency that produces a well-defined outcome). An efficiency frontier is a collection of line segments that can help leaders to visualize the value of each option. It is created by calculating slopes along the efficiency frontier, providing cost-effectiveness information to inform leaders about options representing efficient spending. Below, we introduce an example and apply the concepts using results from a published article.
The theory of choosing among multiple options
Efficiency frontier
Assume you must fund one of four options. The expected cost and outcome (effect) for each option are plotted in Figure 1.
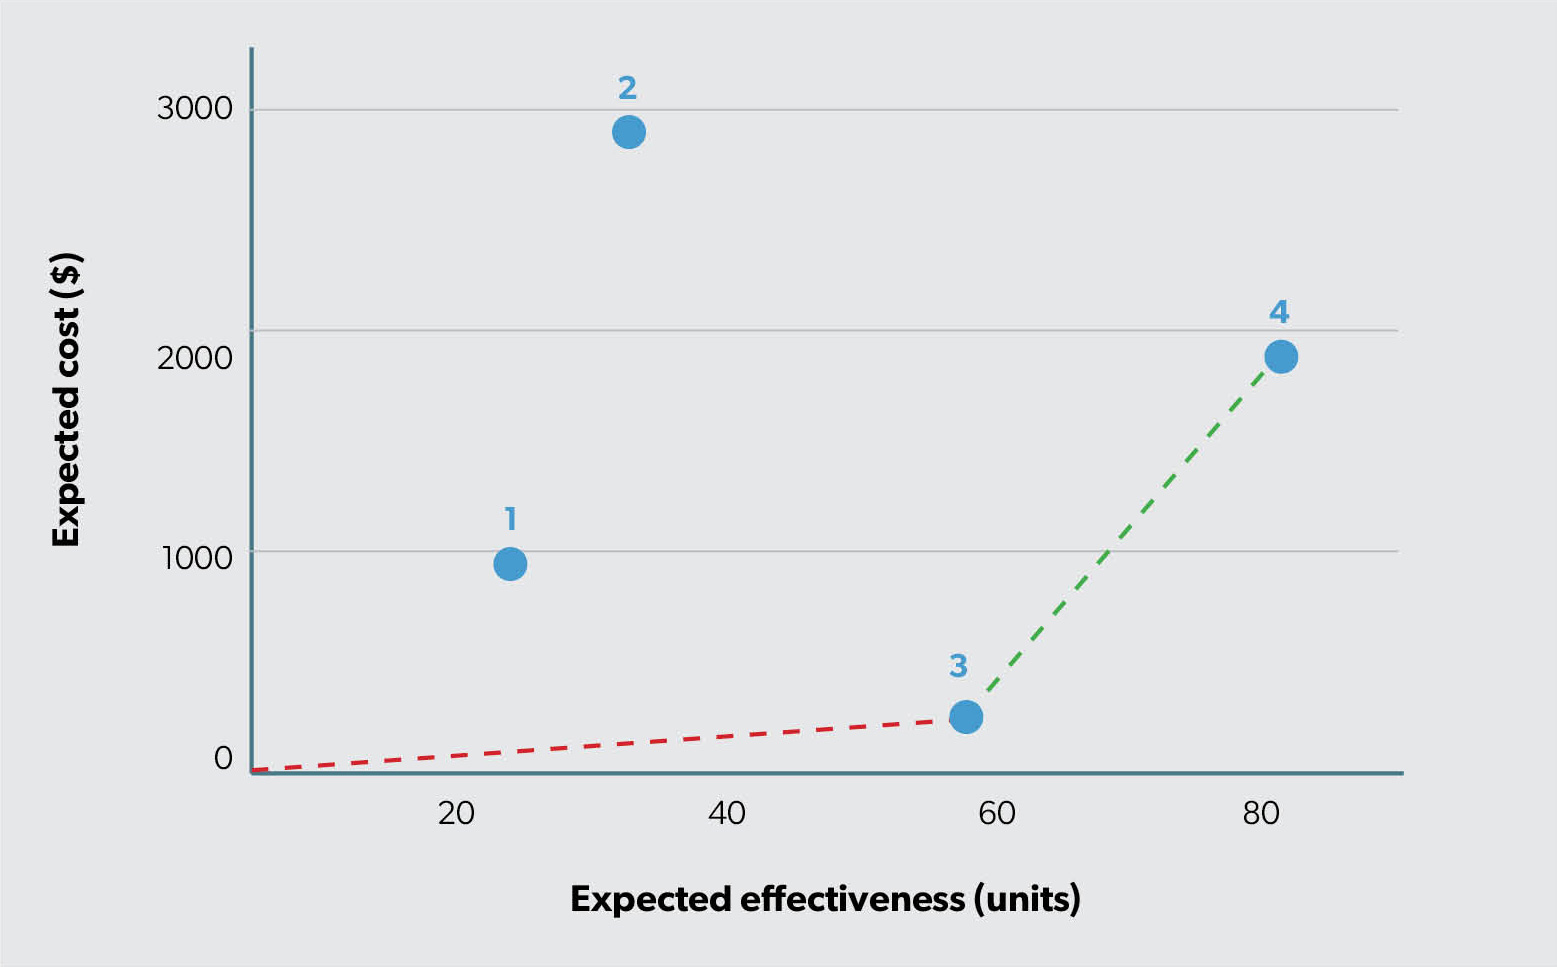
Figure 1. The efficiency frontier
It is helpful to start with the question, What are we currently spending and what are we currently getting for that expenditure? If we assume that status quo is no expenditure and no effectiveness, then the efficiency frontier will begin at the point 0, 0 (i.e., the origin in Figure 1). The efficiency frontier is drawn by starting at “usual care” and drawing a line to each of the options under consideration, creating, in this case, four lines extending from the origin (not shown in the graph). Next, we identify the line with the smallest slope (shown in Figure 1 as a dashed red line). Slope is calculated as the ratio of rise to run, the increase in cost divided by the increase in effectiveness. In this example, the smallest slope is associated with going from usual care to option 3. Now, we examine the slopes of lines from point 3 to the other three options (i.e., the remaining blue dots). Following this process, the next option to consider, if funding is available, is option 4; the line connecting option 3 to option 4 has the lowest slope in absolute terms (shown in Figure 1 as a dashed green line).
The two options inside the efficiency frontier (options 1 and 2) are considered inferior to options 3 and 4. As Figure 1 shows, they are relatively more costly and less effective than options 3 or 4 or any combination of options 3 and 4. Based on this, analysts often drop options like 1 and 2 from further consideration.
Cost-effectiveness analysis with multiple options
The next step explores the extra cost and extra effect of each option on the efficiency frontier. Compared with option 3, the extra cost of option 4 ($1588) and extra effect (25 units) are summarized in a ratio computed as the extra cost per extra unit of effect (i.e., $1588/25 ≈ $64). In cost-effectiveness analysis, this trade-off is called the incremental cost-effectiveness ratio (ICER); in this example, the ICER estimate is $64. The ICER for option 3 compared with the status quo is $5. This is clearly a better “unit price” at which to buy extra outcome compared to $64; however, if one wants more outcome than option 3 can provide, one must consider option 4. Option 4 provides additional outcome but at a higher additional cost. Leaders decide if the additional gain is worth the additional cost; research creates evidence that can inform these decisions.
Application
Efficiency frontier
A study by Coyle et al.1 estimated the cost-effectiveness of a new drug to augment elective orthopedic surgery. Table 1 shows the four options they considered. We use their results to demonstrate how to apply the concepts discussed above.
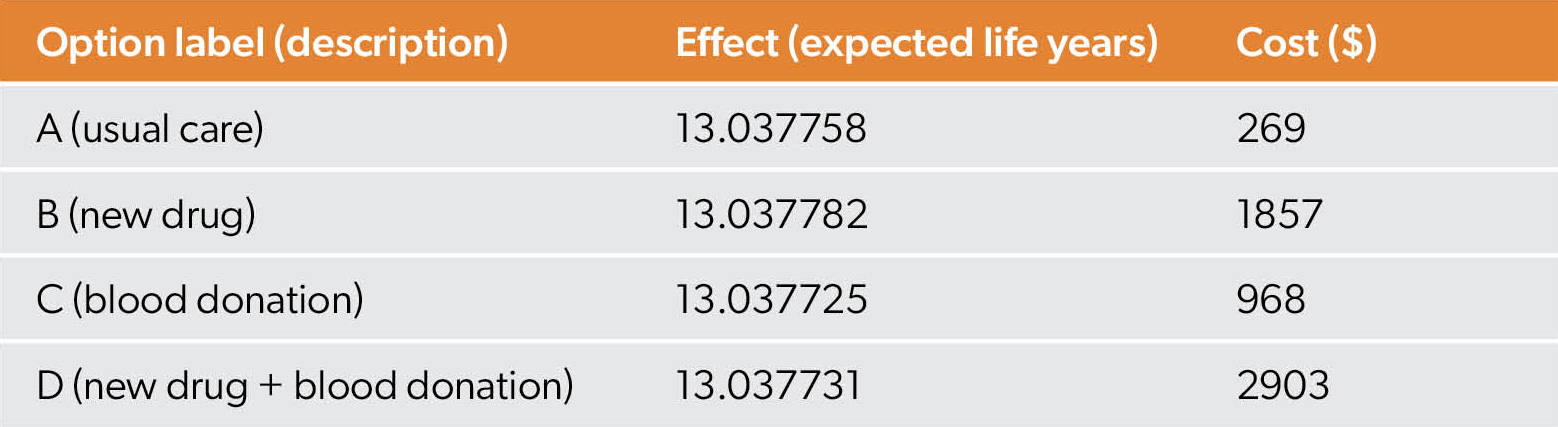
Table 1: Expected effect and cost of four mutually exclusive options.
Before charting the efficiency frontier, it is a good idea to sort the options by size of effect (Table 2).
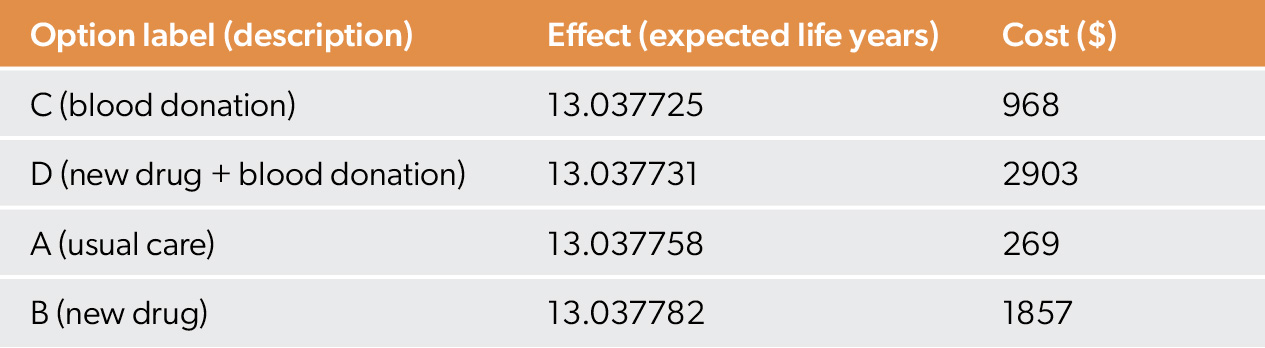
Table 2: Expected Effect and Cost for four mutually exclusive options, after sorting from least to most effective.
The estimates in Table 2 should make us suspicious of options C and D; they provide less outcome but cost more than usual care. In other words, usual care “dominates” options C and D. Intuition suggests the real decision may be between A and B.
Next, we plot the data (Figure 2). The graph looks similar to Figure 1 with its constellation of points. However, the main message from the data is distorted by the x axis; although this version allows even spacing of the data points, it is much distorted by the fact that it does not start at 0.
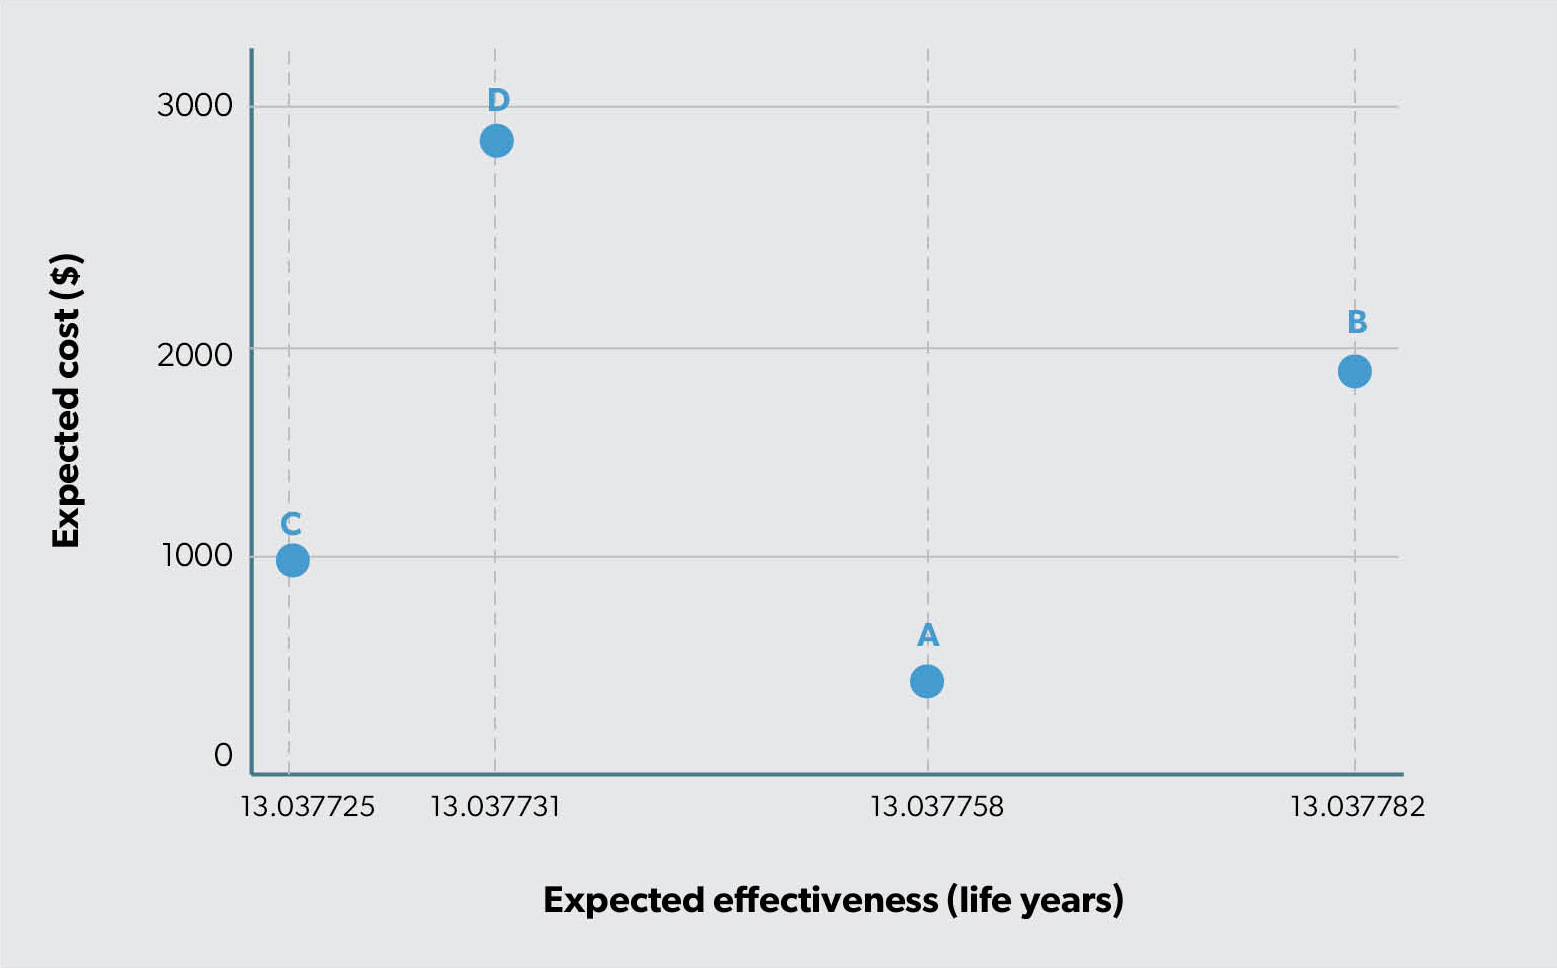
Figure 2: The efficiency frontier using data from Table 2.
Figure 3 shows the same data but with the horizontal range starting at 0 (instead of 13.037725 as in Figure 2).
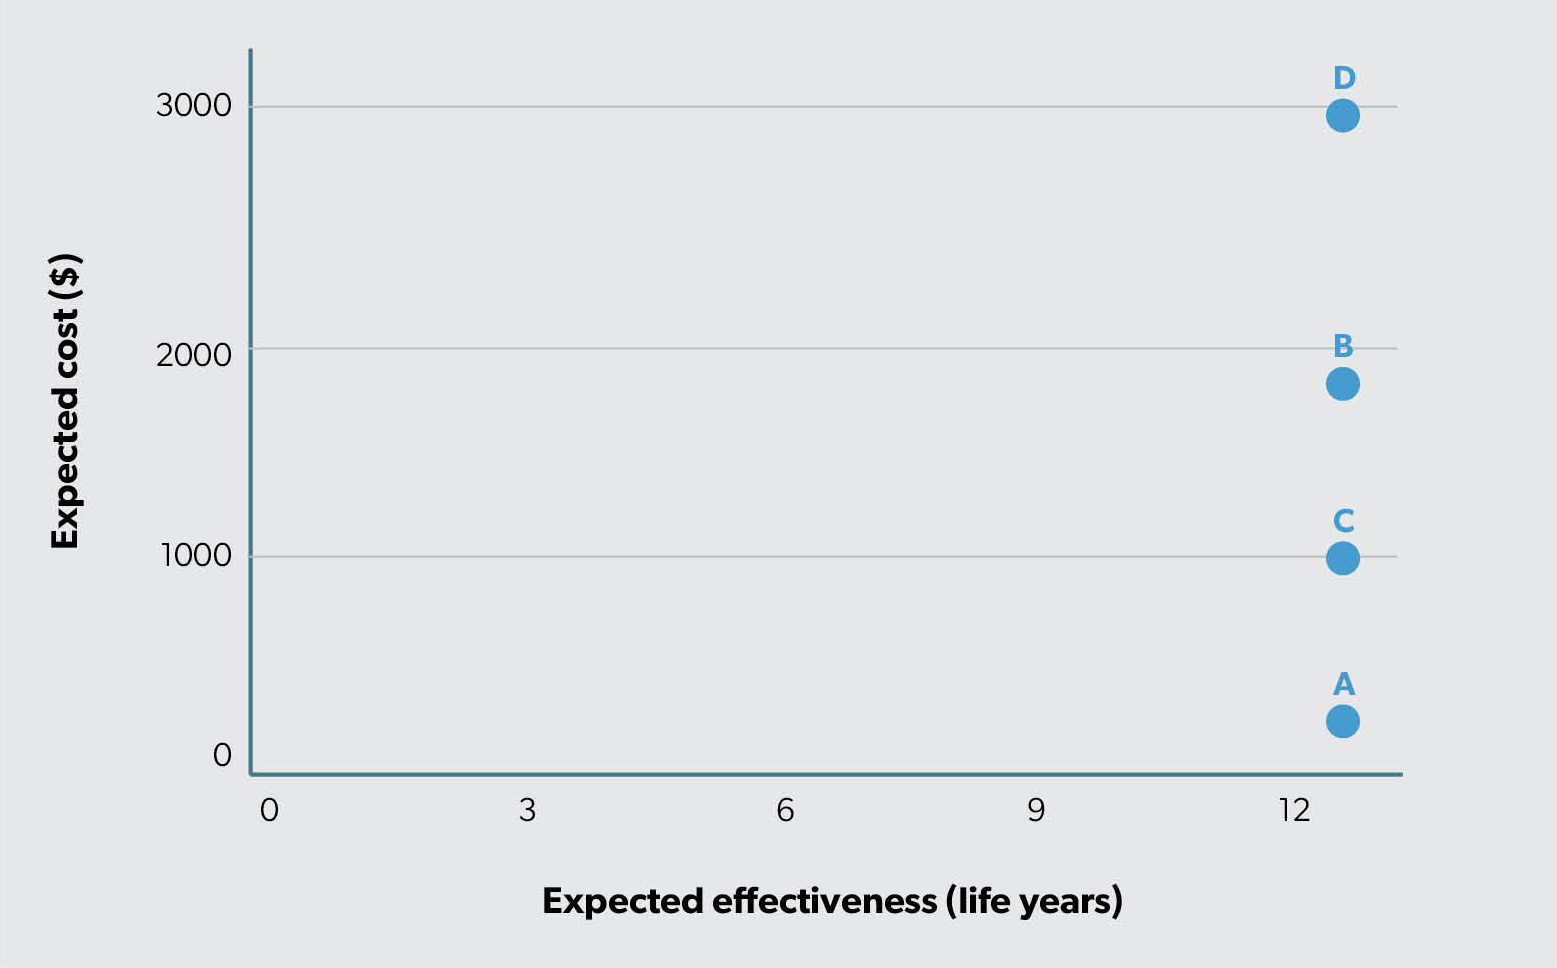
Figure 3: The efficiency frontier using data from Table 2 and a normal horizontal axis.
Figure 3 clearly shows that all four options produce almost the same amount of outcome. With each option having approximately the same expected effect, it makes sense to choose the cheapest way to purchase this amount of outcome. For leaders who want to drill down into the exact efficiency of each option, cost-effectiveness analysis is next.
Cost-effectiveness analysis
Cost-effectiveness analysis compares options on the efficiency frontier. From Figure 3, it is nearly impossible to visualize the efficiency frontier (the dots are so close to each other!). Fortunately, Figure 2 magnifies the differences in effect, so we can create an efficiency frontier using that graph. The first step is to identify which option is the “usual care” or “current situation.” Table 2 lists option A as usual care. This becomes our starting point.
From that starting point, we draw lines to the other options and choose the line with smallest slope, making option B our next point on the efficiency frontier; it is the next cheapest way to provide more effect (for more cost) after option A. This is similar to the line segment from option 3 to 4 in Figure 1.
Cost-effectiveness analysis suggests that going from option A to option B is not very efficient. The extra cost is $1588 (i.e., $1857 minus $269) and the extra effect is 0.000024 years of life (i.e., 13.037782 minus 13.037758). That is about 13 minutes. If you spend $1588 to buy 13 more minutes, you are spending at a rate of nearly $66 million per additional year of life. Mathematically, the line segment connecting option A to option B in Figure 3 has a slope of $66 166 667 per additional year of life. As is visually apparent, going from point A to point B involves spending a lot more to gain very little.
Discussion
There may be good reasons to switch from standard care (option A) to the new option B, but economic efficiency is not one of them. The authors of the article concluded, “Thus, any decision to adopt the [new drug] prior to… surgery will involve the use of scarce health care resources which could be used for other health care interventions, and must be justified by factors other than cost-effectiveness.”
The idea that leaders should be good stewards of scarce resources (like money) stems from the belief that resources spent one way are no longer available for other opportunities. This concept of “opportunity cost” is the basis of why leaders should care about efficiency and research that provides economic evidence. Previous articles in this health economics series have argued that opportunity cost is both essential:
As a leader, you are a steward of your organization’s most precious resources. When you invest them, whether time or money, your choices are important. You purposefully choose to direct resources toward higher value alternatives. Understanding costs allows you to do more with your organization’s scarce resources to achieve its goals and fulfill its mission.2
and potentially multi-dimensional:
One leader’s “wasting resources” may be another leader’s “investing resources.” It is acceptable for leaders to emphasize inefficiency on a single metric as long as their organization’s mission is advanced in other areas of strategic importance. Spending resources inefficiently (for no conceivable gain in value) is a dereliction in a leader’s duty of stewardship of scarce resources (punishable by a course or two in economics).3
In addition to the truth that leaders may have more than one objective they are trying to optimize, there is also the issue of uncertainty. The points on the figures we examined are simply estimates. It is possible that the true values of these estimates may lie elsewhere in 95% confidence intervals that are not shown in this type of analysis. Typically, the remedy for this type of statistical uncertainty is to (1) characterize the uncertainty (e.g., use a 95% confidence interval) and (2) collect more information. However, when evidence gathering must move at the speed of decision-making, both 1 and 2 may not be as necessary as academics think they should be. The other type of uncertainty attending these types of analyses has to do with not knowing a number. This is not fixed by collecting more data. For example, when we compared option 4 to option 3 the trade-off was about $64 in extra cost for an additional unit of outcome. Is that worth it? The short answer is, “It depends.”
In this article, we demonstrated how to make recommendations based on constructing the efficiency frontier and using cost-effectiveness analysis. These recommendations must be considered in light of uncertainties that may affect the placement of the options on the efficiency frontier or the existence of priorities that may make “inefficient” options seem like worthwhile investments. To see an example of this in your hospital setting, peruse the overview of the Canadian Coordinating Office for Health Technology Assessment from 19984 and compare it with what happens in your hospital regarding elective orthopedic surgery. Economic evidence can inform decision-making, but it is not sufficient to make the decision for you. Leaders must make value judgements. Considering the efficiency of health care spending using the results of cost-effectiveness can help inform the decision.
References
1. Coyle D, Lee KM, Fergusson DA, Laupacis A. Economic analysis of erythropoietin use in orthopaedic surgery. Transfus Med 1999;9(1):21-30. https://doi.org/10.1046/j.1365-3148.1999.009001021.x
2. Hoch JS, Dewa CS. Cost is not a four-letter word: focus on what you can change. Can J Physician Leadersh 2024;10(2):64-8. https://doi.org/10.37964/cr24783
3. Hoch JS, Dewa CS. The occult of efficiency: frank, and Stein’s, advice for physician leaders. Can J Physician Leadersh 2024;10(1):29-32. https://doi.org/10.37964/cr24780
4. Otten N. Economic evaluation of erythropoietin use in surgery. Ottawa: Canadian Coordinating Office for Health Technology Assessment; 1998. Available:
https://www.cda-amc.ca/sites/default/files/pdf/eposurgery_ov_e.pdf
Author
Jeffrey S. Hoch, MA, PhD, is a professor in the Department of Public Health Sciences at the University of California Davis (UC Davis). He is chief of the Division of Health Policy and Management and associate director of the Center for Healthcare Policy and Research at UC Davis.
Carolyn S. Dewa, MPH, PhD, is a professor in the Department of Psychiatry and Behavioral Sciences and the Department of Public Health Sciences at UC Davis.
Correspondence to: jshoch@health.ucdavis.edu