

HEALTH ECONOMICS
Analyzing cost-effectiveness data: from calculation to illustration
![]()
Jeffrey S. Hoch, PhD, and
Carolyn S. Dewa, MPH, PhD
In this sixth article in a series on health economics, we focus on computing cost-effectiveness statistics. We provide examples of how leaders can communicate the findings and illustrate the main points. Building on previous articles, we show calculations and introduce options to communicate the results visually to make the message clear. Although many factors influence a decision, efficiency is an important one, and the results of cost-effectiveness analysis can help guide a value-based strategy in an economically attractive manner.
KEY WORDS: leadership, cost-effectiveness analysis, health economics
Hoch JS, Dewa CS. Analyzing cost-effectiveness data: from calculation to illustration. Can J Physician Leadersh 2025;11(3): 143-151. https://doi.org/10.37964/cr24798
Greater data availability provides an opportunity to study the efficiency of new options and novel interventions using cost-effectiveness analysis (CEA).1-5 CEA examines both costs and outcomes simultaneously, distinguishing itself from cost-minimization where only costs are considered. Although CEA can be conducted by modelling with a collage of estimates and best guesses supported by the scientific literature and expert opinion, it is also possible to do CEA using a cost-effectiveness dataset. In this article, we illustrate how to create and present CEA results. While CEA can seem to be an academic exercise, physician leaders may be motivated to study cost-effectiveness not just as knowledge for knowledge’s sake, but also as a foundation of accountability for resources being spent.6
Economic modelling plays a major role informing health technology assessment processes in Canada and throughout the world; however, for pragmatic decision-making, analysis of available data is often enough to inform a decision. In fact, Hunter and Franklin7 argue that analyzing a cost-effectiveness dataset can be satisfactory, except when the data are not fit for purpose. “Modelling is necessary in situations with incorrect comparators, when a key outcome of interest is not captured, and if evidence synthesis (e.g., meta-analyses) is possible/required.”7 Therefore, in this article, we assume that readers are analyzing a dataset with a correct comparator, a key outcome of interest, and relevant costs.
Cost-effectiveness with a yes/no outcome
Separate reporting of cost and effect
Assume you are considering whether to invest in a new option and you want to use CEA to help inform your decision. Based on a pilot study at your organization, you have the following findings in terms of expected cost (Figure 1) and expected outcome (Figure 2).
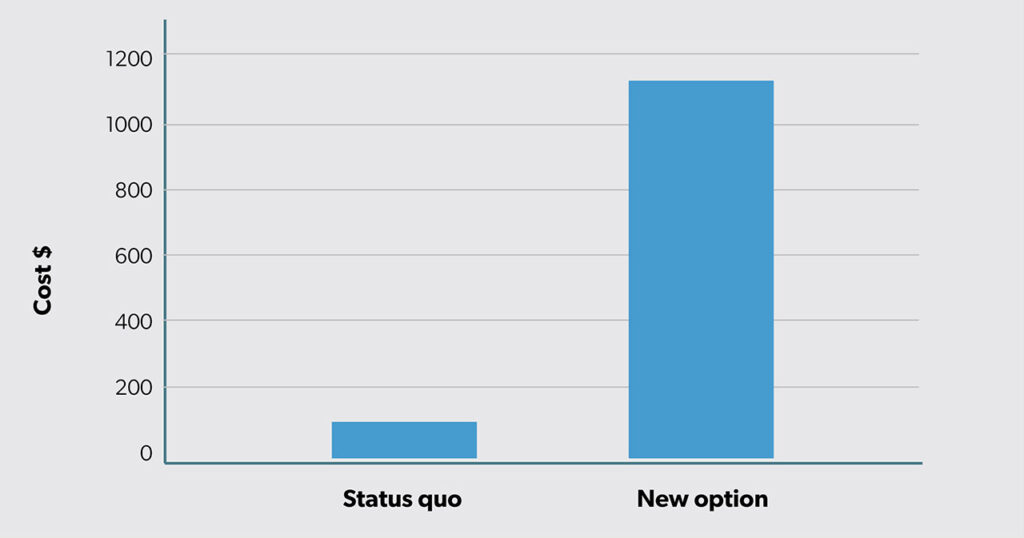

The new option has greater expected costs (i.e., $1100 − $100 = $1000 more). However, the new option is also more effective, with an expected success rate of 65% (40% more than the status quo at 25%).
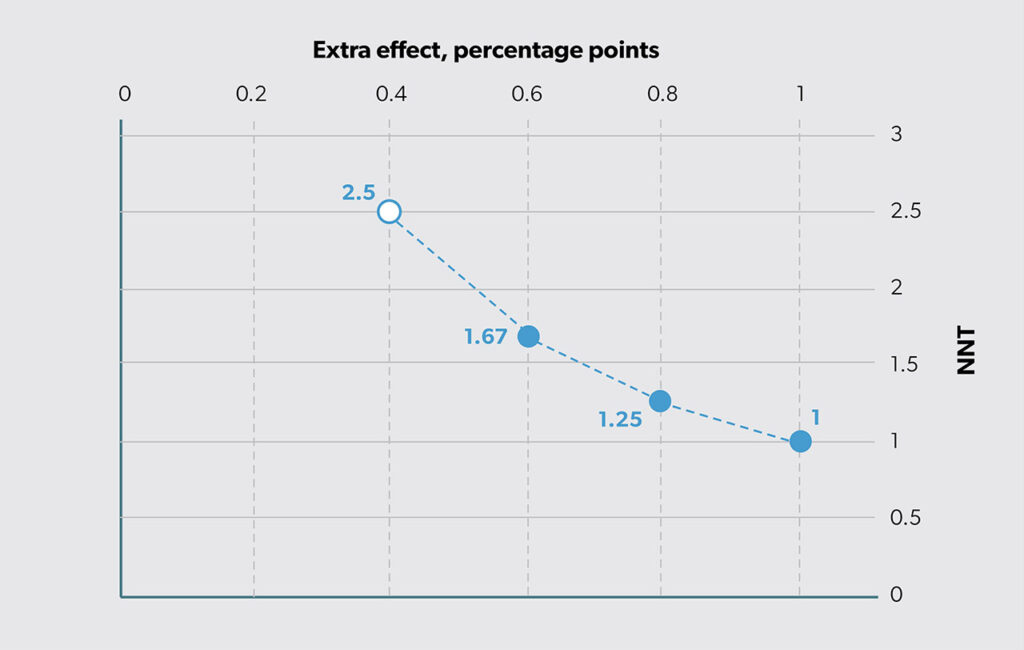
Another way to summarize this effect difference is by looking at “number needed to treat” (NNT).8 Cordell9 states, “NNT provides a clinically useful ‘yardstick’ of the effort required to have a beneficial outcome or prevent a bad outcome with a therapy.” To compute NNT, we first calculate the difference in percentages (i.e., 65% − 25% = 40%) and then take its reciprocal (i.e., 1/40% = 2.5). Based on this finding, we can say that we need to use the new option in place of status quo for three people to achieve one additional success. Thus, effectiveness can be reported either as a straight difference or as the reciprocal of that difference (as NNT). The relationship between extra effect (ΔE) and NNT is shown in Figure 3. The open circle shows that the estimated ΔE = 0.4 on the horizontal axis is the same as NNT (1/0.4 = 2.5 on the vertical axis).
Reporting cost and effect together
One of the main summary statistics used in CEA is the incremental cost-effectiveness ratio (ICER), the ratio of the extra cost (ΔC) to the extra effect (ΔE). In our example, the ICER = ΔC/ΔE = $1000/0.4 more successes or $2500 per additional success. Alternatively, the ICER can be calculated as the product of ΔC and NNT, labeled “costs of additional treatment success” (COATS) by Weiss et al.10 Calculated this way, the ICER equals $1000 x 2.5 = $2500 for one more success. Thus, whether you divide extra cost by extra effect (ΔC/ΔE) or multiply extra cost by NNT (ΔC x NNT), you get the same result for your economic evaluation.
Figure 4 illustrates the results of the ICER computed as the ratio of extra cost to extra effect (i.e., ΔC/ΔE). The slope of the line equals the ICER estimate. Also, the height of the line for extra effect = 1 is the ICER (i.e., the vertical height of the open circle in Figure 4).
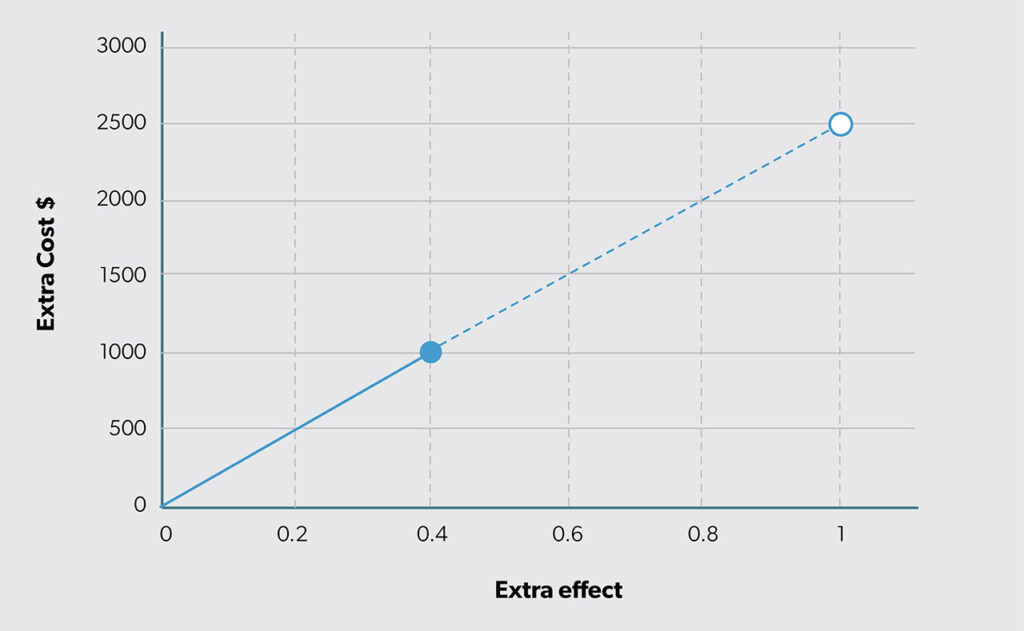
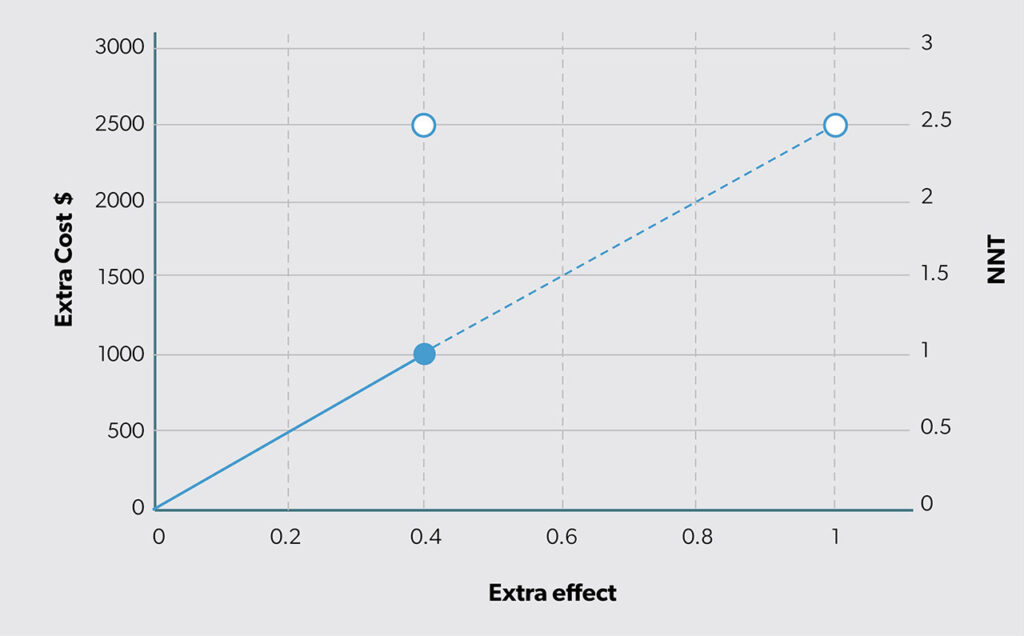
The solid circle in Figure 4 appears at the intersection of the estimated extra cost (ΔC = $1000 on the vertical axis) and extra effect (ΔE = 0.4 on the horizontal axis). The open circle illustrates the extension of the ray from the origin to an extra effect of 1 (in Figure 4, the actual estimated difference is 0.4). The value of the vertical axis for an extra effect of 1 equals the ICER value ΔC/ΔE = 2500. If that ICER value is divided by the extra cost (ΔC), the result is NNT (1/ΔE). Therefore, the concept of NNT can be introduced into CEA. Figure 5 combines Figures 3 and 4 by adding a second vertical axis value on the right side to include NNT.
Cost-effectiveness with a continuous outcome
In the previous example, the outcome variable was binary (either failure or success). However, often the outcome of interest is a continuous variable, such as life years, length of stay, disability days. In this case, the interpretation of NNT is slightly different because the interpretation of 1/ΔE is slightly different. Estimating ΔE based on continuous data produces an NNT estimate of how many people need to switch to the new option to produce one more unit of outcome, rather than how many people need to be switched to help one more person.
For example, in a study of the cost-effectiveness of a collaborative mental health care program for people receiving short-term disability benefits, the authors considered both continuous and binary outcomes.11 One continuous outcome was 16 fewer days lost from work, and a binary outcome was extra effect of a 0.23 percentage point improvement in return to work.
Although it is possible to compute NNT for both effect measures (i.e., NNT = 1/16 = 0.0625 and NNT = 1/0.23 ≈ 1/0.25 = 4), it easier to interpret the NNT result for the binary outcome. The NNT of 4 means that one must treat that many with the new intervention to achieve one additional positive outcome (in this case an additional employee returning to work) compared with the status quo. In other words, for every four people in your organization, one extra person will benefit if you implement the new option.
The other outcome, which is the continuous effect measure, has a larger ΔE and, therefore, a smaller 1/ΔE which makes interpretation awkward. For every 0.0625 employees in your organization, 1 extra unit of outcome will be obtained if you implement the new option in place of status quo. For this reason, NNT is not often chosen as a summary statistic in CEA when the effect variable is continuous. In general, “NNTs can aid the interpretation of results… using continuous outcomes. Where possible, these should be reported alongside mean differences.”12
Although agreement on the use of NNT is not universal, previous studies provide a sense of different relative sizes. As Murad et al.13 suggest:
NNT became popular with the increased momentum of the evidence-based medicine (EBM) movement, which has become the modern approach for making healthcare decisions. NNT was promoted in EBM workshops and was used to compare interventions and think about their cost-effectiveness. For example, when comparing NNT for primary prevention of heart disease across various interventions over a five-year period, 44 people need to be treated with pravastatin to prevent one event of myocardial infarction, stroke, or death. In comparison, the NNT was 140 for beta-blockers, 346 for aspirin in men, and 426 for aspirin in women.14
Therefore, it is more typical to calculate sample averages with cost and outcome data and then compute their differences. For example, Table 1 shows the expected costs and outcomes for status quo and a new option using a hypothetical dataset.
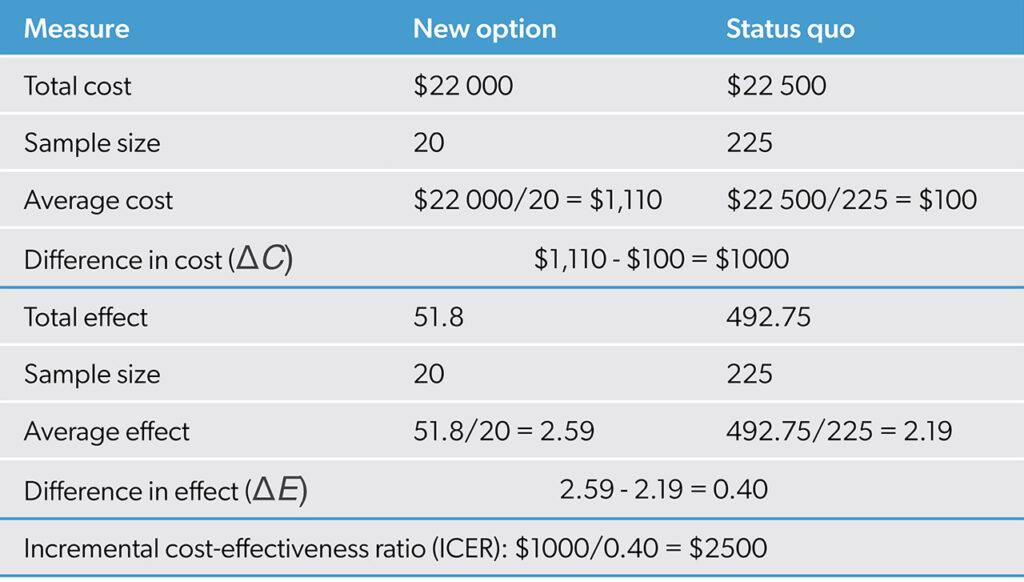
With a cost-effectiveness dataset, expected costs and outcomes can be estimated using sample means. The extra cost is the difference in the mean costs, and the extra effect is the difference in the mean outcomes. The ICER is calculated as shown earlier as the ratio of extra cost to extra effect. In this case, the ICER estimate is ΔC/ΔE = $1000/0.4 = $2500. As the new option provides 0.4 more units of outcome for an additional $1000, it is producing at a rate of 1 additional unit of outcome for $2500. Figure 4 illustrates the result.
Discussion
The example we explored focused on a new option that had an estimated ICER of $2500 per additional success. This type of information can be challenging to integrate into decision-making. Because the ICER is a fraction, there is no way to know how it came to be $2500 except by examining its constituent parts. The most intuitive way to do this is by using a graph like Figure 4. Looking at the horizontal and vertical axes, it becomes clear exactly how much more effect is produced by the new option (i.e., ΔE) and how much cost (i.e., ΔC) to expect per person. Based on the math for the ICER, buying 0.4 more units of outcome for $1000 is the same deal as buying half that quantity (i.e., ΔE = 0.2) for half the cost (i.e., ΔC = $500).
However, a leader may not feel this way. You may not view 0.2 more units for $500 the same way you view 200 more units for $500 000. In both cases, they yield an ICER of $2500 (i.e., $500 000/200 = $500/0.2). The solid circle in Figure 4 clarifies the estimated extra cost and extra effect. The ICER expresses what extra cost would be if extra effect were 1. In situations where ΔE ≠ 1, as in almost all cases, the ICER is neither relaying the expected extra cost nor the expected extra effect. It is reporting the extra cost at which one unit of additional outcome is being produced.
When effect is binary (e.g., the outcome of interest is of a yes/no variety), it may be easier to consider NNT in addition to ΔE. For example, an ICER of $2500 for a new option that has a NNT = 1000 has an ICER of that magnitude because of the large NNT. Since the ICER is the product of ΔC and NNT, this means ΔC = $2.50. The driver of inefficiency here is the relatively small ΔE, which corresponds to the relatively large NNT. Plotting the results in Figure 4 would show a solid point on the line at 0.001 on the horizontal axis and $2.50 on the vertical axis. This clarifies why the cost-effectiveness estimate, the ICER, turned out to be that number.
Some of the limitations of Figure 4 and Figure 5 as they are currently shown include not incorporating the overall budget, not characterizing statistical uncertainty, and not factoring in other important decision factors. Typically, CEA reports an ICER and that statistic does not describe the total cost of the new option to your organization. The new option’s total cost is computed by adding on to the status quo’s total cost the extra cost of the new option for every person receiving the new option. Thus, something may be cost-effective (e.g., a new hepatitis C drug), but prohibitively expensive (e.g., with an initial price tag for a full course of over $80 000). As for the statistical variability of our estimates (e.g., we used our data to compute means and the data we used vary because of sampling variability), we recommend characterizing the uncertainty using a 95% confidence interval). Because of the technical requirements to make a 95% confidence interval for the ICER, we leave this topic for future discussion. Finally, because Figure 4 cannot show all of the other important decision factors when considering the ICER of $2500 in its proper social and political context, we must accept CEA as just one part of the decision-making process. When changing from status quo to the new option, the trade-off of $2500 in extra cost for an additional unit of outcome may be worth it. Or maybe not. The goal is to communicate an understanding of the efficiency of new opportunities. Leaders can use the CEA results along with other contextual considerations to arrive at and communicate their value judgements about new options.
In this article, we demonstrate how cost and outcome data can be analyzed to estimate the cost-effectiveness of a new option. The analysis involved calculating sample means for cost and effect and then computing the difference in the means (comparing a new option to the status quo). The ICER, the fraction of the difference in mean cost over the difference in mean effect is estimated from data this way. The cost-effectiveness statistic expresses the efficiency rate for one additional unit of outcome. If the outcome is binary, then one additional unit of outcome is one more person being helped. How many people must receive the new option to help one more person is the NNT concept. Thus, CEA can be viewed as encompassing estimates of both extra cost as well as NNT. When the effect measure is a continuous outcome, the focus is on the extra cost for one more unit of outcome. The results of cost-effectiveness can help inform decisions, but leaders must make value judgements, and these do not frequently appear in the figures.
References
- Hoch J, Dewa C. The occult of efficiency: Frank and Stein’s advice for physician leaders. Can J Physician Leadersh 2024;10(1):29-32. https://doi.org/10.37964/cr24780
- Hoch J, Dewa C. Cost is not a four-letter word: focus on what you can change. Can J Physician Leadersh 2024;10(2):64-8. https://doi.org/10.37964/cr24783
- Hoch J, Dewa C. Maximizing success when it is the product of two things that go in opposite directions: the magic of elasticity. Can J Physician Leadersh 2024l10(3):84-91. https://doi.org/10.37964/cr24784
- Hoch JS, Dewa CS. Cost-minimization analysis: showing something is cheaper does not necessarily mean it is better. Can J Physician Leadersh 2025;11(1):31-9. https://doi.org/10.37964/cr24789
- Hoch JS, Dewa CS. Choosing one from many: efficiency in a multi-option world. Can J Physician Leadersh 2025;11(2):102-8. https://doi.org/10.37964/cr24793
- Hoch JS. Improving the efficiency of cost-effectiveness analysis to inform policy decisions in the real world: lessons from the Pharmacoeconomics Research Unit at Cancer Care Ontario. In Zaric G (editor). Operations research and health care policy. New York: Springer; 2013: pp. 399-416.
- Hunter RM, Franklin M. Whither decision-analytic modelling-based economic evaluation for health care decision making? Pharmacoecon Open 2024;8(4):507-10. https://doi.org/10.1007/s41669-024-00492-9
- Laupacis A, Sackett DL, Roberts RS. An assessment of clinically useful measures of the consequences of treatment. N Engl J Med 1988;318(26):1728-33. https://doi.org/10.1056/NEJM198806303182605
- Cordell WH. Number needed to treat (NNT). Ann Emerg Med 1999;33(4):433-6. https://doi.org/10.1016/s0196-0644(99)70308-2
- Weiss M, Grom F, Porzsolt F. Costs of additional treatment success (COATS) based on numbers needed to treat (NNT) is a simplified calculation method to facilitate physicians medical decisions with regards to monetary costs. Br J Med Med Res 2012;2(4):636-46. https://doi.org/10.9734/BJMMR/2012/1379
- Dewa CS, Hoch JS, Carmen G, Guscott R, Anderson C. Cost, effectiveness, and cost-effectiveness of a collaborative mental health care program for people receiving short-term disability benefits for psychiatric disorders. Can J Psychiatry 2009;54(6):379-88. https://doi.org/10.1177/070674370905400605
- Froud R, Eldridge S, Lall R, Underwood M. Estimating the number needed to treat from continuous outcomes in randomised controlled trials: methodological challenges and worked example using data from the UK Back Pain Exercise and Manipulation (BEAM) trial. BMC Med Res Methodol 2009;9:35. https://doi.org/10.1186/1471-2288-9-35
- Murad MH, Falck-Ytter Y, Ramachandran N, Davitkov P, Morgan RL. The number needed to treat: it is time to bow out gracefully. J Clin Epidemiol 2025;187:111924. https://doi.org/10.1016/j.jclinepi.2025.111924
- Ridker PM, MacFadyen JG, Fonseca FA, Genest J, Gotto AM, Kastelein JJ, et al. Number needed to treat with rosuvastatin to prevent first cardiovascular events and death among men and women with low low-density lipoprotein cholesterol and elevated high-sensitivity C-reactive protein: justification for the use of statins in prevention: an intervention trial evaluating rosuvastatin (JUPITER). Circ Cardiovasc Qual Outcomes 2009;2(6):616-23. https://doi.org/10.1161/CIRCOUTCOMES.109.848473
Authors
Jeffrey S. Hoch, MA, PhD, is a professor in the Department of Public Health Sciences at the University of California Davis (UC Davis). He is chief of the Division of Health Policy and Management and associate director of the Center for Healthcare Policy and Research at UC Davis.
Carolyn S. Dewa, MPH, PhD, is a professor in the Department of Psychiatry and Behavioral Sciences and the Department of Public Health Sciences at UC Davis.
Correspondence to: jshoch@health.ucdavis.edu